Ultrasonic Testing for Metallurgical defect of the Stainless Steel
There are many methods developed for the detection of the steel flaws. Ultrasonic Testing (UT) method by sending pulse ultrasonic wave into the steel sample to check its discontinuity has been widely used in the industry fields. But there are some factors hindering its behavior. For example, the coarse grain by which slab is composed can act as the scattering centers when tested, and form the randomly distributed background noise obstructing the recognition of the flaw echoes.
So the metallurgical and digital signal processing methods are indispensable when accurate result is required. In this work, the steel samples were prepared before the test was conducted and then ultrasonic echo signals was recorded, via wavelet transform for the aim to analyze transient nonstationary signals with distortion as little as possible signals were analyzed on the different frequency scales without losing time domain information.
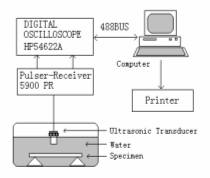
The ultrasonic testing inspection system consists of several parts, including a pulser/receiver, a transducer, and a display device. A pulser/receiver produces electrical pulses. These high voltage pulses work with the transducer to generate ultrasonic energy. This sound energy travels through the stainless steel in the form of waves. When a discontinuity (i.e. a crack) is discovered in the wave path, some of the energy is reflected back from the flaw. This flaw signal is converted into an electrical signal by the transducer, creating a meaningful display on the display device.
The flaw lies in the steel mainly including inclusions, bubbles and cracks. All of them can affect the quality of the steel in some degree, so the flaw detection and recognition is becoming more and more significant and urgent, especially when the quality of the steel is emphasized. Artificial Intelligence (AI), Expert Systems and Neural Networks could be used to classify defects automatically. Neural Networks have been widely employed in the field of function approaching, pattern identification and data compression, such as learning vector quantization netwoks, probabilistic networks, Self-organizing maps which have been reported for the signal classification works.
In this issue, recorded ultrasonic signals containing different defect echoes have been decomposed by wavelet transform and analyzed by multiresolution technique, then separated detailed characteristic waveforms which represent the intrinsic waveform feature of the original defect signals, with length of 120 discretely sampled points. They were extracted from the special detailed level of decomposed signals, and used as the data set for the neural networks. There were totally 42 chains of feature data of flaw echoes collected, training set was made up by 32 chains randomly collected from them, the remains was used as the testing set named set I, testing set II was formed by 10 chains randomly chosen from training set. The experiment involves 3 kinds of defects, two of them are natural defects in the steel, inclusions and bubbles, another kind is the man-made slot defect with width about 300m.
Basic principle
Wavelet transform Wavelet Transform (WT) processes the signal with the localized core function, and has the excellent resolution either in time or in frequency domain. Therefore it is considered to be the ideal means for analysis of transient nonstationary signal. Multiresolution signal decomposition using WT can provide detailed location feature and frequency information at any interested decomposition level, focusing on any part of signal details. By definition, the WT is the correlation between the signal and a set of basic wavelets, the WT of a square integral signal s(t) is given by [8~11]:

Neural networks The neural network is constructed by a large number of interconnected simple neurons which is the basic unit of the network and is the simplification and simulation of the biological neural cell. To some extent, the neural network’ characters are determined by the characters of the neuron. When neurons are settled, characters and functions of the network mainly depend on its topological structure and its learning method. Learning mechanism is the basic property of the neural network and is realized by the adjustment of its weights and thresholds. There are two kinds of learning mechanism including supervised and unsupervised learning. When neural networks employed in flaw classification, learning vector quantization networks, probabilistic neural networks, and self-Organizing maps etc. can be used.
Experimentation
Specimen preparation Considering the ultrasonic center frequency used in this work is a relatively higher than counterpart of normally used, the steel samples were carefully prepared beforehand, and tailor-made into specimens to facilitate the testing. Specimen preparation mainly gives attention to the following: firstly controlled sample thickness because testing sensitivity can be maintained effective throughout the specimen thickness. Secondly, by grinding the surfaces of the steel specimen, the negative influence resulted from surface roughness can be reduced, the surface roughness can be about 1.6m after specimen was grinded.
Detection system configuration The test system configuration is shown in Fig. 1, following instruments were used to capture the data, 20MHz transducer (Panametrics, V116-RM, 3mm diameter), 200MHz HP54622A digital oscilloscope, Panametrics 5900PR ultrasonic pulse-receiver analyzer, and personal PC. The detection work was carried out by immersing the specimen and the probe perpendicularly into the water to avoid the influence of the near field of energy transformer. The detected result is displayed in A-Type ultrasonic scanning mode. The system was calibrated to produce 3 back wall echoes on the full screen.
The test was carried out according to following procedure:
- Inspection of the specimen by the immersion mode
- Signal process and character data extraction
- Check of the ultrasonic test results by metallographic examination
- Classification of the character waveform data
- Selection of the neural network architecture
- Training of the neural networks
- Testing of the neural networks

Fig. 1 Schematic diagram of the experimental ultrasonic system.
Ultrasonic testing and signal processing
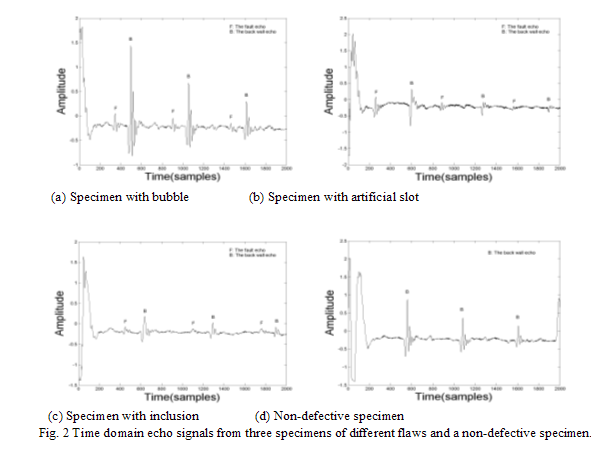
The typical signals tested on three kinds of defects, bubbles (a), artificial slot (b), and inclusions (c), together with the signal from a non-defective specimen (d) were presented in Fig. 2. In each of them, 3 back wall echoes were plotted from the first water-specimen interface to the third back wall echo of the specimen. The duration of the signal is about 5.42 microseconds, and 1.68 microseconds was needed for ultrasonic wave traveling into and out of the specimen, flaw echoes locate randomly among the ultrasonic time course.

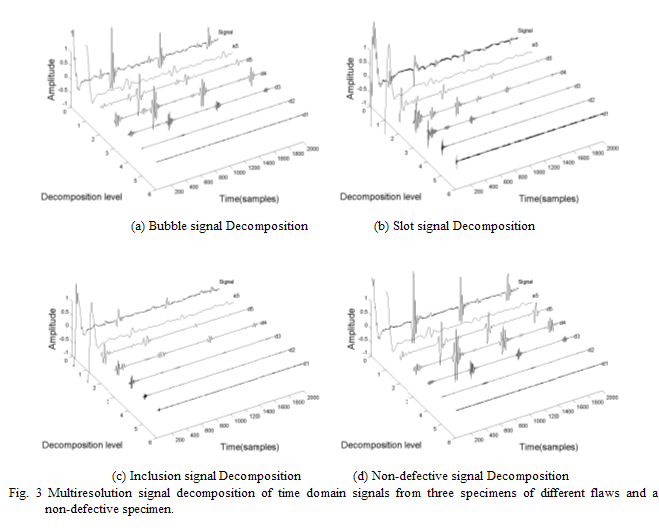
Fig. 3 presents the waveform results after the different original signals have been processed using the wavelet transform (mother wavelet DB5, decomposition level 5) for multiresolution analysis, the typical reconstructed coefficient waveforms from each of them are plotted separately. After an original signal was decomposed by 5 levels, an approximate coefficient and five detailed coefficients were produced, which represent different scale of frequency information embedded in the original signal. The noise signals mainly distributed on the high frequency coefficient level, such as d1 and d2, and defect echo appeared on comparatively low frequency coefficient level, d3~d5. Comparing different levels of each flaw signal, it can be concluded that waveform differences on d5 scale is more obvious than that on the other two high frequency scales, d3 and d4. After high frequency noise signal was filtered, the waveform of coefficient d5 from inclusion signal has distinguished with waveform character compared with each other. The analysis results show that the inclusion’s cubic character and reflect source had become separate after the samples were rolled.

Neural network classification
Flaw feature extraction According to the results of multiresolution signal decomposition, a chain of 120 discretely sampled points indicating the intrinsic waveform feature of the original flaw signals was extracted from the reconstructed wavelet d5 coefficient and used as the input vector for the neural networks. Fig. 4 shows waveforms of 120 discretely sampled points corresponding to three typical flaws respectively.
In this paper, totally 42 chains were collected including 13 from bubble flaws, 9 from artificial slots, 20 from inclusions, all of them were taken from the first ultrasonic cycle in the specimen, after the disturbance of the probe near field had been eliminated. Signal analysis reveals the echo amplitude was comparatively higher than other later cycles. Based on these results 32 data chains were randomly collected for the training set, the remained 10 signals were used as the testing set named set I, and the testing set II was 10 data chains randomly chosen from the training set.
Flaw classification using the neural networks
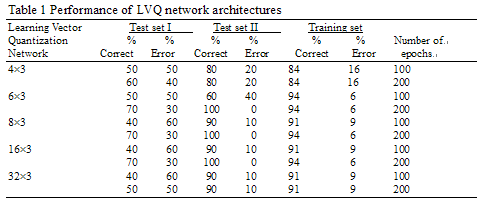
Learning vector quantisation network LVQ networks are composed by a competitive layer and a linear layer, the competitive layer is responsible for classification of the input vectors, the linear layer then transforms the competitive layer's classes into target classifications pre-defined. The number of neurons in the linear layer is less than that in the competitive layer. The results obtained by the LVQ network are described in Table I from which it can be seen that the best performance is reached by the network architectures with 6, 8, or 16 neurons in the competitive layer after enough training epochs performed. In the architecture of above three kinds, the misclassifications in test set I were 2 bubbles classified as inclusions and a artificial slot classified as a bubble while the error in the training set was two inclusions classified as artificial slots in the architecture with 6 competitive neurons, a bubble was classified as inclusion in the architecture with 8 or 16 competitive neurons.

Probabilistic neural network Probabilistic neural networks are consisted by two layers of radbas neurons, the number of neurons in the first layer is equal to the number of input vectors. The second layer is competitive layer, its neuron number is the same as that of training specimen classes and each neuron represents a class. A competitive transfer function on the output of the second layer produces the results by picking the maximum of calculated probabilities. Table 2 presents the results from the Pnn network after 100 epochs of training, the misclassification was a inclusion and a artificial slot classified as bubbles, and a bubble classified as an inclusion.

Self-Organizing maps The architecture of Self-Organizing Maps based on the simulation of human cortex, and the neurons in the layer of an SOFM are arranged originally in physical positions according to a topological function, only a layer of neurons is used for network construction. The SOM networks apply unsupervised learning algorithm and produce different responses with differed input vectors. Two kinds of distance functions were tried for the network training separately. The results produced by the SOM networks are described in Table 3 illustrating that the result varies dramatically with the change of distance function. The results with maximum distance function revealed that the misclassifications ratio in the training set was nearly 53% while 34% error occurred with distance function of the Euclidean metric, simultaneously revealed by the test set I showed bad verification which contradicted with the expectation. This might result from signal overlap between different flaw signals, and might also indicate that the specimens in the training set need to be increased.

Summary
In this issue different techniques such as steel specimen preparation method, wavelet transform signal processing method, and neural network classifications were used for the investigating the classification possibility of the small metallurgical defects, such as inclusions, bubbles, and cracks. It was believed that such approach would be beneficial in evaluating the quality of the steel product.
The investigation results produced from the network architectures show that the correctness ratio of classification is from 70 to 100% based on practical and man-made defects and a comparatively simple feature extraction method. The performance can be accepted in the light of rough evaluation.
The approach used in the work for the flaws detection and classification can be summarized as following:
- Specimen preparation, in this work, all of the specimens tested were 5mm in thickness
- Immersion ultrasonic testing
- Feature extraction after multiresolution signal decomposition using wavelet transform
- The comparison of different network architectures
- Training and testing of selected networks
Based on the experimental results, the following key points are concluded:
- Appropriate specimen preparation procedures were needed for the performance of the high center frequency ultrasonic probe.
- Multiresolution signal decomposition using wavelet transform can help feature extraction of defect echoes, and compress the length of input vector needed by network training.
- The Pnn network is faster than LVQ network while the more accurate classification result can be produced compared with ther network architectures.
- The LVQ network can classify defects satisfactorily after enough training epochs, and neuron over-increase in the competitive layer has no obvious help in classification while classes need to be clearly discriminated required by more perfect network performance.
- The SOM network performed least satisfaction of the architectures used, this may be restricted with the nature of unsupervised training.
References
-
Agostino Abbate, Jeff Koay, Julius Frankel etal .Singnal Detection and Noise Suppression Using a Wavelet Transform Signal Processor: Application to Ultrasonic Flaw Detection. IEEE ,1997;44(1):14~25
-
Guangming Zhang, Shuyi Zhang, Yuwen Wang. Application of adaptive time-frequency decomposition in ultrasonic NDE of highly-scattering materials. Ultrasonics ,2000;38:961~964
-
Margrave F W, Rigas K, Bradley D A etal .The use of neural networks in ultrasonic flaw detection. Measurement,1999; 25: 143~154
-
Baker A R,Windsor C G. The classification of defects from ultrasonic data using neural networks: the Hopfield method. NDT International, 1989;22:97~105
-
Santos J B, Perdigão F. Automatic defects classification a contribution. NDT&E International,2001;34:313~318
-
Angrisani L, Bechou L, Dallet D etal . Detection and location of defects in electronic devices by means of scanning ultrasonic microscopy and the wavelet transform. Measurement, 2002; 31: 77~91
-
Legendre S, Goyette J, Masicotte D. Ultrasonic NDE of composite material structures using wavelet coefficients. NDT&E International, 2001;34:31~37
-
Chen J, Shi Y, Shi S. Noise analysis of digital ultrasonic nondestructive evaluation system. International Journal of Pressure Vessels and Piping, 1999; 76: 619~630
-
Chen Y J, Shi Y W, Zhang X P. Detection of weak bonding in friction welds by ultrasound. Ultrasonics, 1998;36:141~146
-
Xiaoyan Tang, Udantha R, Abeyratne. Wavelet transforms in estimating scatterer spacing from ultrasound echoes. Ultrasonics, 2000;38: 688~692
-
Gregorio Andria, Filippo Attivissimo, Nicola Giaquinto. Digital signal processing techniques for accurate ultrasonic sensor measurement. Measurement, 2001;30: 105~114
|
